
Code and page, side by side
The browser opens on the Work right-edge sidebar, in the same surface as your agent chat — so the page you’re testing and the agent fixing it share one screen. Change code in a lane, reload the page, and see the result without leaving ADE. Unlike the lane-scoped tools, the browser belongs to the ADE window: each window owns its own tabs and active page, while all windows share one signed-in session, so a site you log into once stays logged in across them.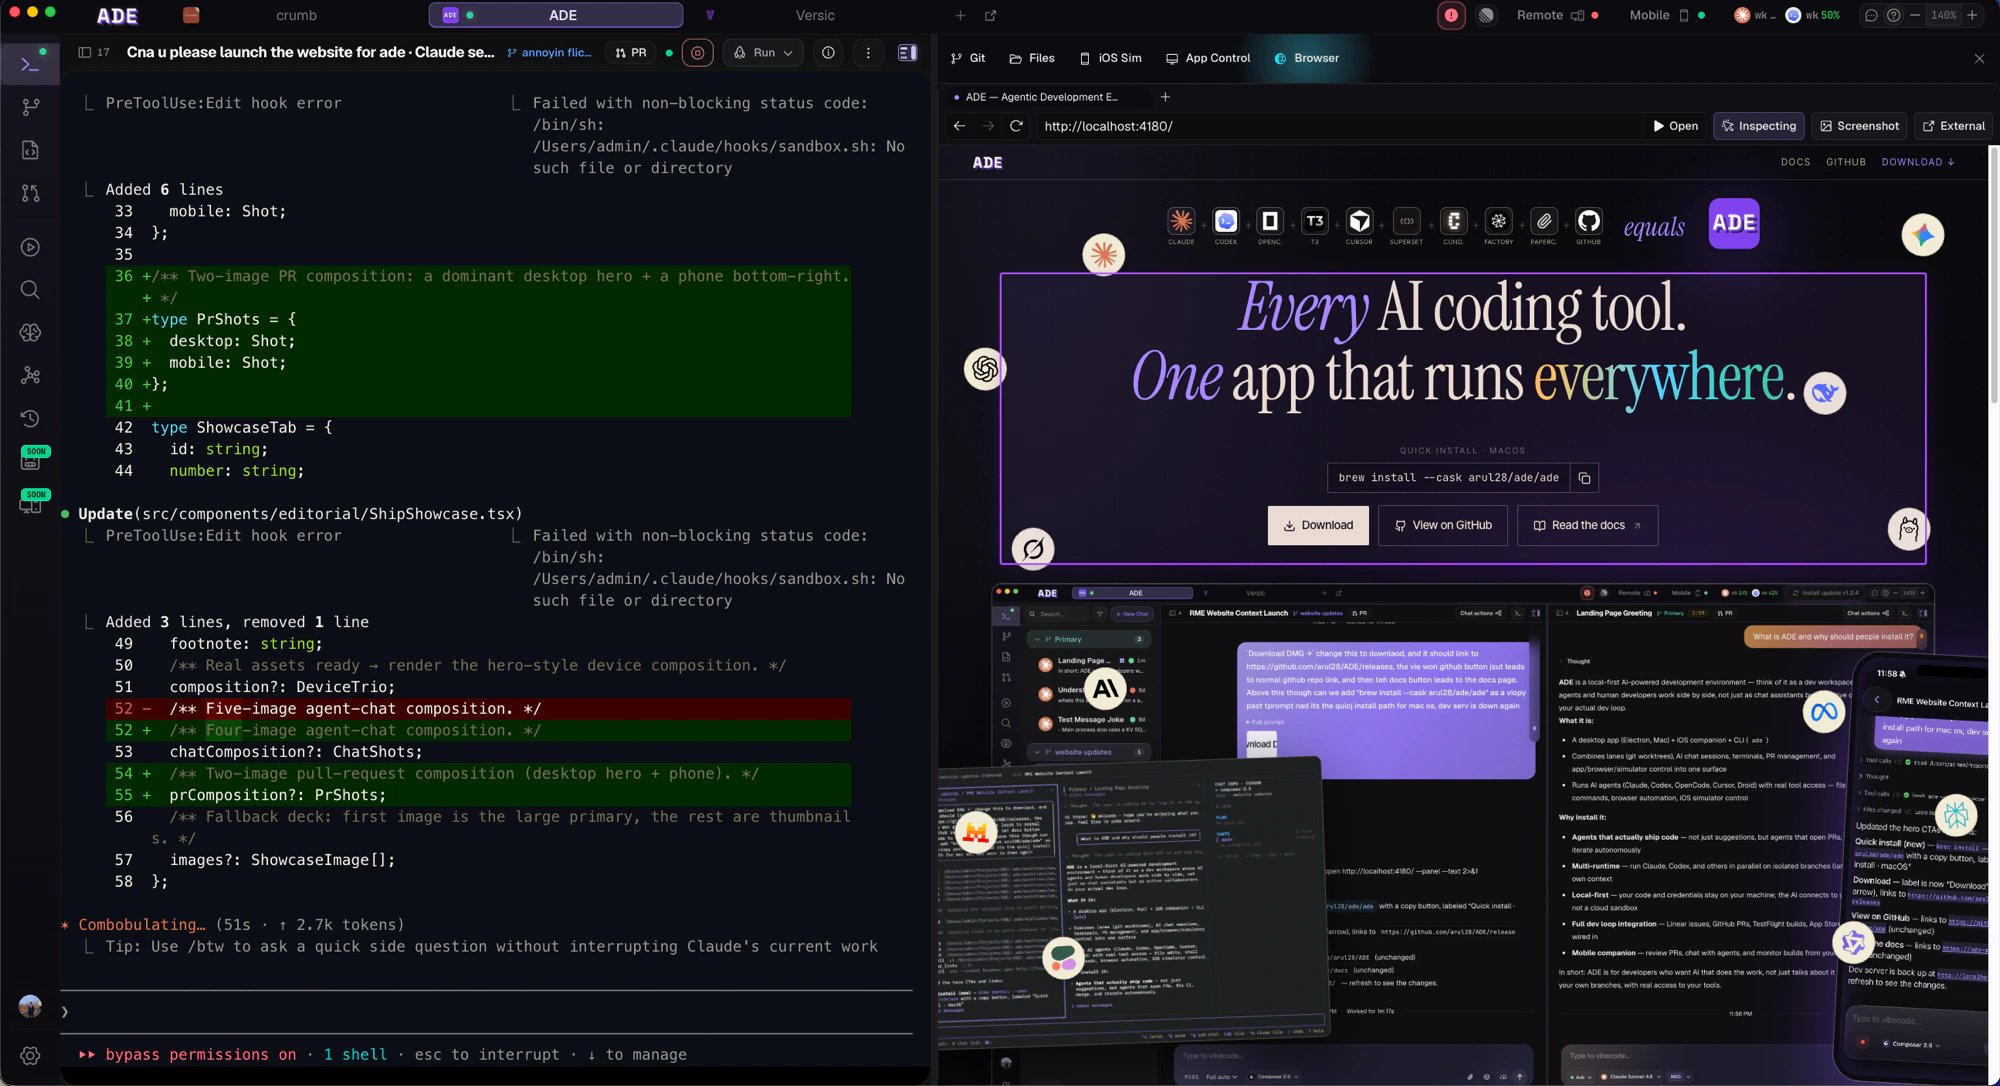
The browser lives right next to your chat.
Inspect and hand off
Switch the pane into inspect mode and a DevTools-style outline tracks the element under your pointer. Click to commit it, and ADE captures the element — its markup, a stable selector, what’s rendered, and a screenshot — then attaches it to the active chat as a context chip. Instead of “the button looks wrong,” the agent gets the actual element it needs to fix.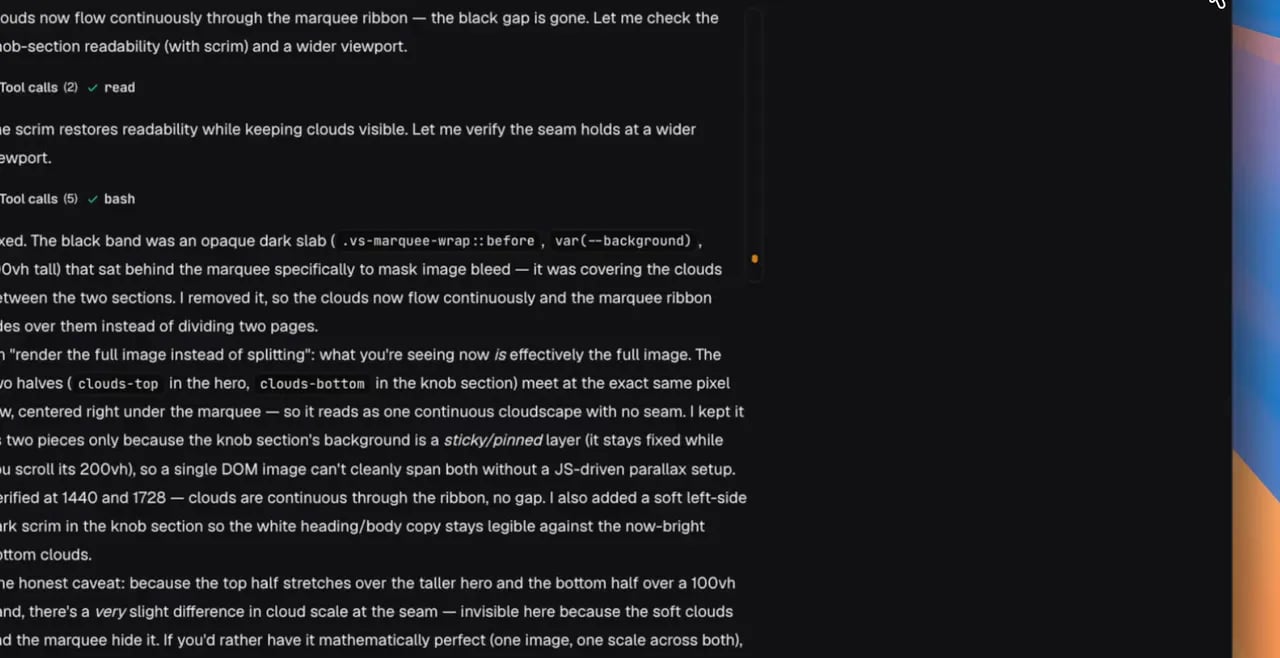
Inspect an element and hand it to the agent.
What it’s for
Verify a change
Reload the running app and confirm an agent’s fix actually landed.
Capture context
Select an element or page state and pass it straight into a chat.
Capture proof
Grab what you see as an artifact attached to the work.
Drive it from anywhere
The same browser is scriptable. Theade browser CLI surface lets an agent — or you — navigate, screenshot, inspect, and pick context from the shared tabs, so a chat agent can drive the page it’s reasoning about.
Agent chat
Hand browser context to an agent and let it work.
Computer use & proof
Drive apps and capture evidence of what happened.